Power BI is a powerful business analytics tool developed by Microsoft. It allows users to visualize data, share insights, and make data-driven decisions. Power BI is widely used for its ability to turn raw data into meaningful insights, helping organizations make informed decisions.
To access Power BI, sign in at our O365 -portal: https://o365.oulu.fi
- Select Apps from the sidebar on the left.
- Apps view should default to the Productivity tab, which is where you can find Power BI.
- Now with Power BI open, there should be another sidebar on the left with different navigation options. Select Browse.
- Here you can see your recently opened statistics, favourite statistics and statistics that have been shared with you.
How to read reports in Power BI
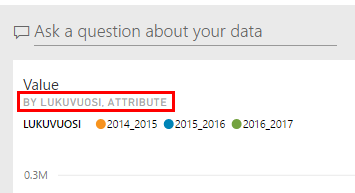
Once you have selected the statistics view (Dashboards), you can explore the report in more detail by clicking the Attribute link at the top.

This link allows you to examine the report in greater detail.
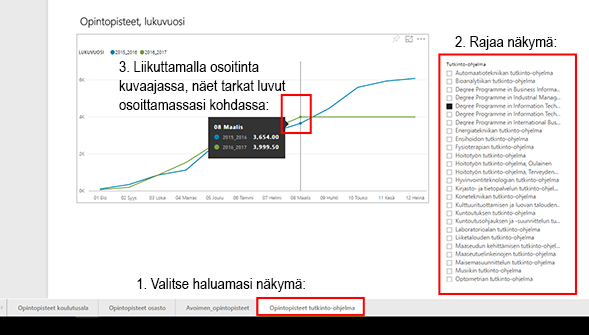
If multiple views are available, you will see tabs at the bottom of the page: Select the one you want to view. If there is a filter available in the view, you can choose the item to be examined by clicking the desired filter. When you move your mouse over the chart, you will see more detailed figures at the point where your cursor is.

Detailed examination of the report